
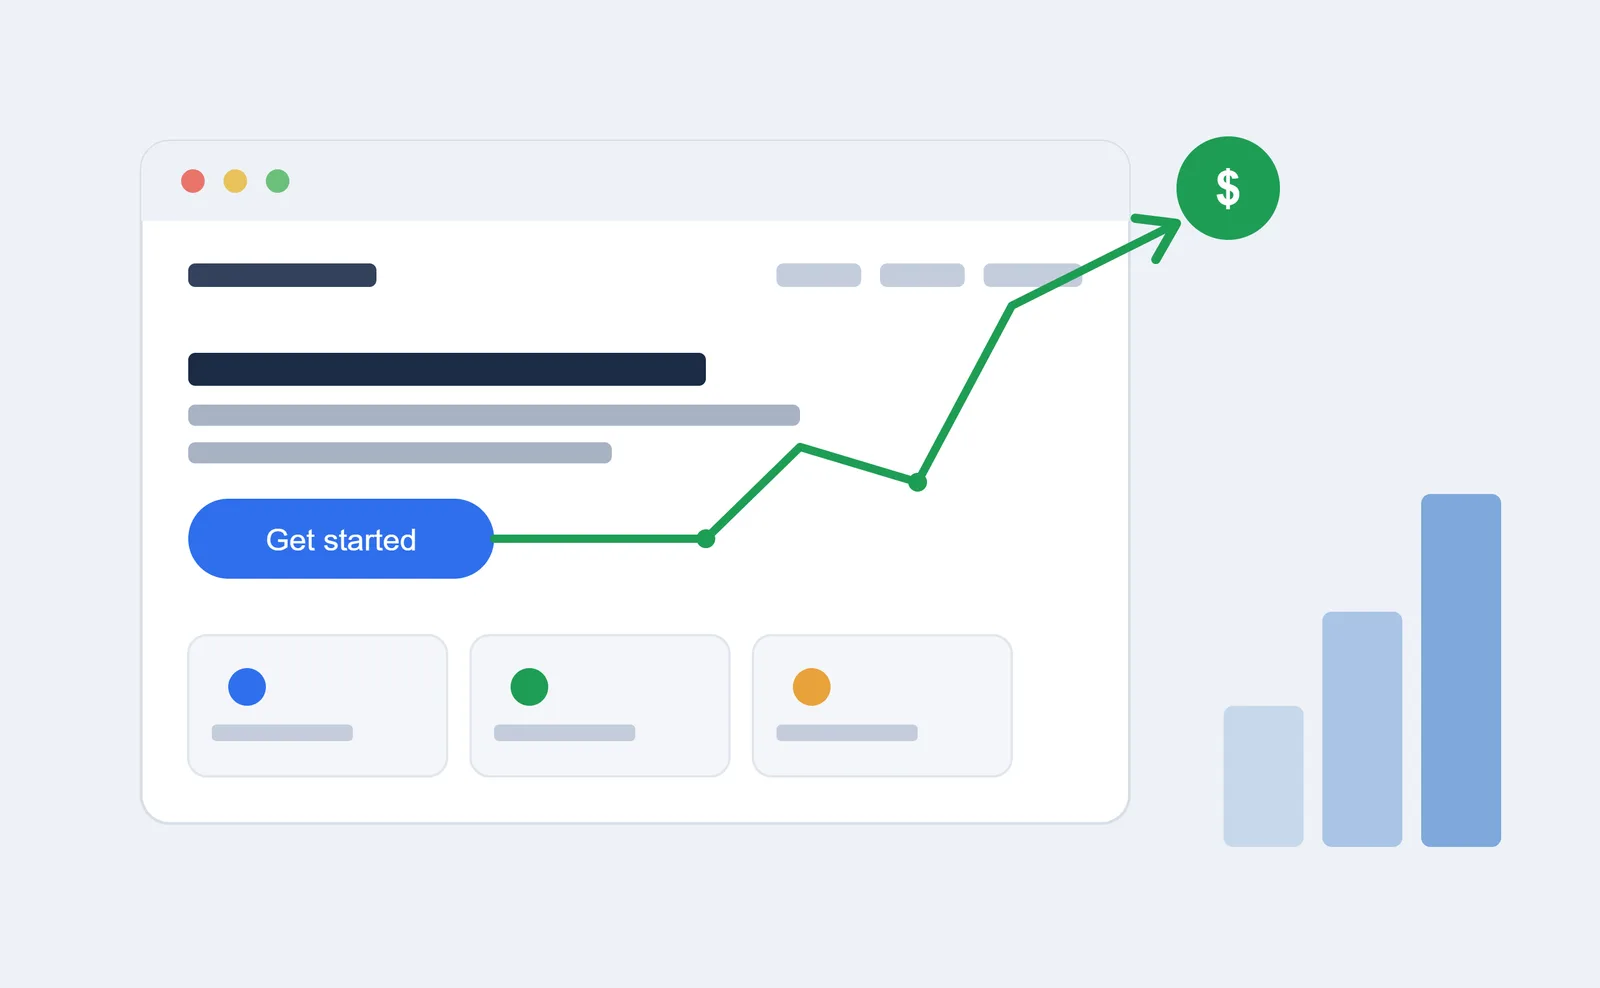
Most business owners understand that a website needs to look polished. What fewer people grasp is that nearly every design choice — from page load times to the number of fields in a contact form — has a measurable link to how much money the business actually makes.
Poor user experience drains an estimated $1.4 trillion from businesses worldwide each year. On the flip side, Forrester Research has found that every dollar put into UX design generates up to $100 in return — a 9,900% ROI. These figures aren't theoretical. They represent countless real customers who hit friction, confusion, or a lack of trust on a website and simply took their business elsewhere.
This piece is aimed at owners and decision-makers in healthcare, pharma, fintech, legal, and SMB sectors across North America and Europe who want a clear, practical understanding of how design connects to revenue — and where to focus for the biggest payoff.
UI vs. UX: Why the Distinction Matters for Your Bottom Line
People often use these terms interchangeably, but they refer to two different things, and each affects revenue in its own way.
UI (User Interface) is everything a person sees and clicks on: colors, typography, buttons, icons, layout. It's the look of your product.
UX (User Experience) is the full journey someone has while using your product — how intuitive it is, how easily they can complete a task, and how confident it makes them feel. It's how your product functions.
Picture a fintech dashboard used by financial advisors. If it looks polished but takes four clicks to surface critical data, the interface is fine — but the experience is broken. Advisors lose time, mistakes creep in, and client confidence erodes. That's a UX failure with real financial fallout.
Forrester reports that strong UI alone can lift conversion rates by up to 200%. Pair it with solid UX, and that number can climb to 400%. For a healthcare company trying to turn trial users into paying customers, or a law firm trying to turn site visitors into booked consultations, that gap is the difference between steady growth and standing still.
What the Data Says About Design's Effect on Revenue
Conversion rates
Forrester's research shows well-executed UX can boost conversions by as much as 400%. More targeted fixes deliver strong results too — the Baymard Institute found that redesigning a checkout or inquiry flow alone can raise conversions by an average of 35% for e-commerce and service companies. Well-placed, thoughtfully designed calls to action can lift revenue by 83%.
We partnered with a pharmaceutical distribution company in Ontario whose patient portal forced users through six separate steps just to submit an order. After a UX audit trimmed that down to three steps, their form completion rate jumped 41%. Nothing about the product or pricing changed — only the experience did.
Customer retention
Research cited by both Forrester and Bain shows that raising retention by just 5% can boost profit anywhere from 25% to 95%. A retained customer costs nothing to win back — but one who leaves due to a frustrating experience takes every future purchase with them.
Nearly 88% of online shoppers say they're less likely to return to a site after a poor experience, and 67% point to a bad experience as their main reason for leaving. In cautious, regulated industries like healthcare and fintech, weak UX doesn't just cost a single transaction — it costs the entire relationship.
Brand credibility and trust
According to research published in Behaviour and Information Technology, 75% of users judge a company's credibility based on website design alone, and 94% of first impressions come down to design.
For law firms, financial institutions, and healthcare providers, this isn't a side issue — it's central to the business. Someone choosing between two local law firms will form a judgment based on the trust signals your site sends before they've read a single sentence of your services.
Long-term business performance
The Design Management Institute found that design-led companies beat the S&P 500 by 228% over a ten-year period. These aren't just tech startups with generous design budgets — they're companies across many sectors that treated design as a strategic priority rather than an expense to trim when times get tough.
What Bad Design Really Costs You
Sales lost to friction
An estimated 35% of potential sales slip away because of poor UX. When someone hits confusing navigation, vague calls to action, a slow-loading page, or a form asking for more than it needs, most won't complain — they'll just leave and go to a competitor. The Baymard Institute puts the average e-commerce cart abandonment rate around 70%, with 17% of users naming a confusing checkout as the specific reason they bailed.
The price of slow load times
Speed isn't just a technical detail — it's a core UX issue. A page that loads in one second converts three times better than one that takes five. And if a mobile page takes longer than three seconds to load, 53% of visitors abandon it before it even finishes.
Amazon found that every 100-millisecond improvement in page speed produced a 1% bump in revenue. For an SMB pulling in $2 million a year, shaving even half a second off load time could add roughly $10,000 in annual revenue from a single technical fix. Globally, slow websites are estimated to cost businesses $2 billion a year.
The hidden toll on customer support
Weak UX generates support tickets. When people can't find what they need or get stuck mid-process, they reach out to your team instead. One redesign of GOV.UK's content cut support requests by 40%. IBM reported a 301% ROI from UX work, driven by both higher satisfaction and lower support costs. For IT service providers specifically, a cleaner client portal means fewer inbound tickets without any drop in service quality.
Losing ground to competitors
Roughly 89% of potential clients say they've gone with a competitor directly because of a poor experience. If a rival's site is faster and easier to navigate, they'll capture business that might otherwise have been yours — not because their offering is superior, but because evaluating it was simply easier.
Mobile UX: Where Businesses Are Quietly Losing the Most Revenue
Mobile devices now account for over 60% of global web traffic, yet mobile experience remains one of the most neglected areas of design investment.
Mobile visitors are five times more likely to abandon a task on a site that isn't mobile-optimized. 57% of users won't recommend a business with a poor mobile experience, and 83% say a seamless cross-device experience is essential to them.
67% of users say they're more likely to buy from a mobile-friendly site, and 74% say they're more likely to return to one. Companies that invested in mobile responsiveness reported a 62% jump in sales.
If your site was built before 2021 and hasn't had a dedicated mobile review since, you're almost certainly losing revenue on every mobile visit.
The Design Elements With the Greatest Revenue Impact
Not every improvement carries equal weight. Here are the specific areas that consistently move the needle.
1. Clear navigation — 38% of visitors say layout and navigation structure is the first thing they evaluate on a site. If people can't quickly find what they came for, they leave. Clean, logical navigation lowers bounce rates, keeps people on the page longer, and steers them toward booking pages and contact forms.
2. Page load speed — Speed has a well-documented, direct tie to conversions and revenue. It's also one of the easiest improvements to measure and implement. Check your current speed at pagespeed.web.dev before tackling anything else.
3. Call-to-action design — The size, placement, color, and wording of your CTAs directly shape whether users take the action you want. Thoughtful CTA design can raise revenue by 83%, and using real photography in CTAs lifts conversions by 17%. This isn't about aesthetics — it's revenue engineering.
4. Checkout and form design — For service businesses relying on online bookings or inquiries, the form experience is one of the highest-value places to invest. Trimming unnecessary fields, improving error messages, and adding progress indicators all have measurable effects on conversion. Baymard found checkout fixes can lift conversions by 35% on large e-commerce sites — the same logic applies to consultation forms and patient intake.
5. Visual trust signals — People judge credibility visually before they read a word. Professional photography, consistent typography, visible contact details, and recognizable compliance badges all build perceived trust. In healthcare, legal, and fintech — where clients share sensitive data or make high-stakes calls — these aren't decoration. They're conversion drivers.
6. Personalization — AI-driven personalization is changing what users expect. 70% of Gen Z users expect a site to intuitively understand their needs, and tailoring experiences with AI has been shown to boost engagement by around 30%. For businesses with an established user base and the technical infrastructure to support it, this is an emerging edge worth pursuing.
Accessibility: Both a Legal Obligation and an Untapped Revenue Source
Accessible design — making your product work well for users with disabilities — is a legal requirement across North America and Europe, and it's also a revenue opportunity most companies aren't capturing.
Inaccessible websites cost businesses an estimated $6.9 billion a year. 43% of customers with disabilities say they're more likely to purchase from accessible sites, and accessibility improvements boost conversion rates by 35% while raising overall satisfaction by 15%.
As of 2026, 98% of websites still fall short of WCAG 2.1 accessibility standards. That represents both a compliance risk for regulated industries and a competitive opening for anyone who closes the gap.
Accessibility isn't limited to screen readers and color contrast. It's about making a product usable for everyone — older users, someone squinting at their phone in sunlight, or someone on a slow connection. These fixes benefit every visitor and strengthen overall UX quality.
Proof in Practice: What Happens When Companies Invest in UX
These numbers become tangible once you see them play out in the real world.
Airbnb redesigned its listing pages with larger photos, a simpler booking flow, and clearer pricing — and saw bookings rise 25% while average time-to-booking dropped 30%.
Staples saw online revenue jump 500% following a UX-focused redesign, according to Human Factors International.
Amazon's finding that every 100-millisecond speed gain equals a 1% revenue increase continues to shape its engineering priorities.
IBM reported a 301% ROI on UX investment, driven by higher satisfaction and reduced support costs.
These aren't niche digital-first companies — they're large, established organizations that quantified the financial payoff of design investment and used the data to justify continued spending. The same logic scales down for smaller businesses: a 35% lift in form conversion delivers the same proportional benefit whether you're handling 10 inquiries a month or 1,000.
Signs Your UX Is Already Costing You Revenue
You don't need a full audit to spot whether design is hurting your numbers. Watch for these warning signs in your analytics.
Bounce rate above 55% on key pages. Healthy sits between 26–40%; anything above 55% on conversion pages suggests friction or mismatched expectations.
Time on key pages under 60 seconds — usually a sign of navigation or content-hierarchy problems.
Mobile conversions trailing desktop significantly — mobile UX is the first place to dig in.
High support volume around routine tasks — if people keep asking how to do something, the interface isn't making it clear enough.
Low return-visitor rate — if people don't come back, the first visit likely wasn't worth repeating.
High impressions, low clicks in Search Console — Google is surfacing your page, but people aren't clicking, often a sign your meta title or description needs work.
How Much Should You Be Spending on UX?
There's no universal number, but there are useful benchmarks. Dedicating around 40% of a digital product or website budget to UX research and design is a commonly recommended target for strong results. Even a modest 10% increase in UX spending can drive conversion rates up by as much as 83%.
For most SMBs and mid-market companies in North America, the highest-value starting points tend to be:
A professional UX audit to pinpoint the biggest sources of friction
A checkout or contact-form redesign if conversion is the priority
A mobile experience review if mobile traffic is high but underperforming
Page speed improvements — technically demanding, but with a direct, measurable payoff
The companies seeing the best returns aren't necessarily the ones with the biggest budgets. They're the ones treating design as a business function with measurable outcomes, not a subjective aesthetic choice.
Frequently Asked Questions
1. Does UI/UX design actually affect revenue? Yes, substantially. Forrester found well-executed UX can raise conversions by up to 400%, and every $1 spent on UX returns up to $100. Design-led companies have outperformed the S&P 500 by 228% over a decade, while poor UX costs businesses an estimated $1.4 trillion globally each year.
2. What's the difference between UI and UX design? UI covers how a product looks — colors, typography, buttons, layout. UX covers how it works and feels to use. Both matter for revenue: strong UI alone can lift conversions by 200%, and pairing it with strong UX can push that to 400%.
3. How does page speed affect revenue? It's directly tied to conversion performance. A page loading in one second converts three times better than one taking five seconds, and going from 1 to 10 seconds of mobile load time raises bounce probability by 123%. Amazon found every 100ms of speed improvement adds 1% to revenue.
4. What counts as a good bounce rate? 26–40% is generally considered healthy, 41–55% is average, and anything above 55% on key conversion pages usually signals UX or content problems pushing people away.
5. How does UX affect customer retention? A 5% improvement in retention can raise profit by 25–95%, since retained customers cost nothing to reacquire and keep generating revenue. 88% of users say they won't return to a site after a bad experience.
6. How long before UX improvements show results? It varies by fix. Speed improvements can show conversion impact within days. Content and structural changes usually take two to four weeks to register in Search Console data. Larger projects like a full checkout or mobile redesign typically show meaningful shifts within four to eight weeks of launch. Setting a baseline beforehand is key to measuring the real difference.
7. What kind of ROI does UX investment deliver? Forrester cites an average $100 return for every $1 spent on UX — a 9,900% ROI. IBM reported 301% ROI through better satisfaction and lower support costs, and companies putting 10% of their development budget toward UX saw an 83% rise in conversions.
8. What are common signs of bad UX? Slow load times, confusing navigation, cluttered layouts, overly long checkout or form flows, weak mobile optimization, unclear CTAs, thin trust signals, and poor accessibility. Most of these surface through a professional UX audit without requiring a full rebuild.
9. Is UX investment worthwhile for small businesses? Yes — the percentage impact holds steady regardless of company size. A 35% lift in form conversion helps a small business proportionally as much as a large one. Starting points like audits, mobile reviews, and targeted redesigns deliver strong returns without demanding a full website overhaul.
Final Thoughts
UI/UX design isn't a line item to cut when budgets tighten — it's the mechanism that determines whether your digital presence turns visitors into clients or hands them to a competitor with an easier experience.
The evidence is consistent: good design drives conversions, builds trust in industries where trust is everything, strengthens retention, and lowers support costs. It compounds over time, because customers who have a good experience come back, refer others, and increase their long-term value to your business.
For companies in healthcare, pharma, fintech, legal, and SMB markets across North America and Europe, competition is fierce and the tolerance for a clunky digital experience keeps shrinking. Clients have options — and the quality of your digital experience often decides whether they choose you.
Your website leaves an impression on every visitor, every day. The only question is whether that impression is working for you or against you.